

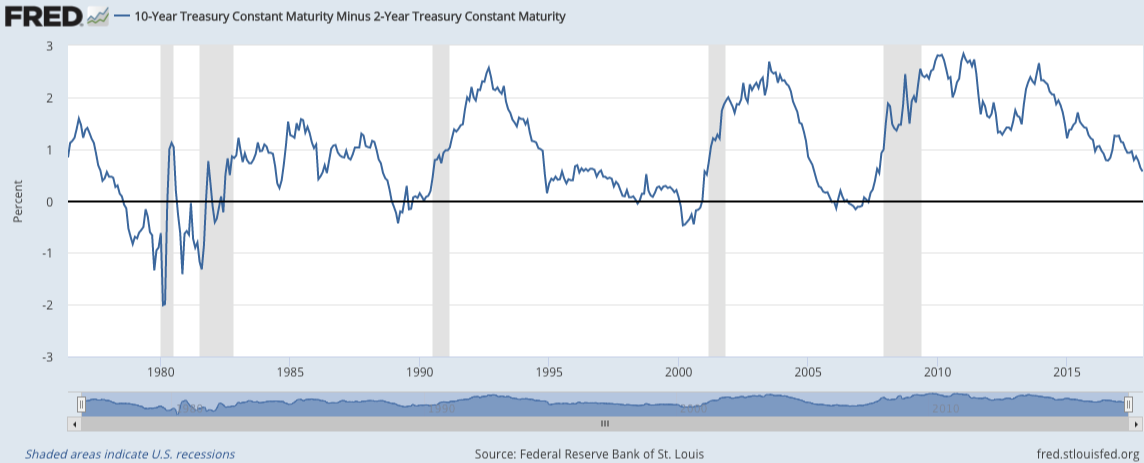
The yield curve has all the charisma of a plumbing diagram. It is a line connecting interest rates on U.S. Treasury securities with different maturities, and it rarely appears in dinner-table conversation. Yet when that line turns upside down, investors suddenly treat it like a smoke alarm in a crowded theater.
A yield curve inversion occurs when short-term Treasury securities offer higher yields than longer-term bonds. Under normal conditions, investors demand more compensation for lending money for ten years than for three months or two years. When the opposite happens, the bond market is effectively saying, “The next few quarters may be fine, but we are not feeling cheerful about what comes afterward.”
Historically, inverted yield curves have often appeared before U.S. recessions. Because recessions usually hurt corporate earnings, employment, consumer spending, credit quality, and investor confidence, yield curve inversions are not exactly great news for stocks. However, they are also not precise sell signals. The market may continue rising for months after an inversion, which is why reacting to one requires more judgment than simply locating the nearest panic button.
What Is the Yield Curve?
The Treasury yield curve compares the interest rates available on U.S. government debt ranging from very short-term Treasury bills to 10-year and 30-year bonds. Since Treasury securities are backed by the U.S. government, their yields serve as important reference rates throughout the financial system.
A normal yield curve
A normal curve slopes upward. Three-month bills might yield less than two-year notes, while two-year notes yield less than 10-year bonds. Investors usually expect higher compensation for tying up their money longer because more time means more exposure to inflation, changing interest rates, and general economic uncertainty.
An upward-sloping curve frequently appears when markets expect continued economic expansion. Banks can borrow money at relatively low short-term rates and lend it at higher long-term rates. Companies can obtain financing, households can access credit, and everyone can continue pretending that economic cycles have finally been abolished.
A flat or inverted yield curve
A curve becomes flat when short- and long-term yields are similar. It becomes inverted when short-term rates move above long-term rates. Investors commonly track the difference between the 10-year Treasury yield and either the two-year or three-month yield. The Federal Reserve Bank of New York’s recession model focuses on the 10-year minus three-month term spread, while the 10-year minus two-year spread receives substantial attention from traders and financial media.
Imagine a three-month Treasury bill yielding 5% while a 10-year Treasury note yields 4%. Investors are accepting a lower annual yield to lock up money for a decade. That unusual preference may indicate expectations that inflation, economic growth, and Federal Reserve policy rates will decline in the future.
Why Does the Yield Curve Invert?
Yield curve inversions usually emerge from a combination of Federal Reserve policy and bond-market expectations.
The Federal Reserve raises short-term rates
When inflation becomes excessive, the Federal Reserve may raise its target interest rate. Those increases push up yields on Treasury bills and other short-term securities. Credit cards, business loans, adjustable-rate mortgages, and other borrowing costs also tend to become more expensive.
The objective is to cool demand and bring inflation under control. Unfortunately, monetary policy is not a microwave with a clearly labeled timer. Higher rates can take months to affect hiring, investment, housing, and consumer spending. By the time economic weakness becomes obvious, financial conditions may already have been restrictive for quite a while.
Bond investors expect slower growth
Long-term yields are influenced by expectations for future inflation, economic growth, monetary policy, and the term premium demanded by investors. When markets expect the Federal Reserve eventually to cut rates in response to weakness, demand for longer-term bonds may increase, pushing their prices up and yields down.
The result is an inverted curve: short-term rates remain elevated because current policy is tight, while long-term rates decline because investors expect future conditions to be softer. Federal Reserve research has repeatedly found that the slope of the yield curve contains useful information about recession risk, although models generally perform better when the curve is combined with other variables rather than treated as an all-knowing oracle.
Why Yield Curve Inversions Aren’t Great for Stocks
The inversion itself does not directly remove money from corporate bank accounts. Instead, it reflects and sometimes reinforces conditions that can eventually damage the economy and equity market.
Higher borrowing costs squeeze companies
Businesses frequently use short-term credit to finance inventory, payroll, expansion, and daily operations. When short-term rates rise, refinancing becomes more expensive. Highly leveraged companies may face larger interest expenses precisely when revenue growth begins slowing.
Large, profitable corporations with abundant cash may absorb this pressure. Smaller companies, speculative growth businesses, real estate operators, and firms with substantial floating-rate debt may have a rougher experience. A business model that looked brilliant when money cost almost nothing can become considerably less brilliant when lenders begin charging real interest.
Bank lending can become less attractive
Banks traditionally profit from borrowing or attracting deposits at shorter maturities and lending at longer maturities. An inverted curve can compress that spread. The relationship is more complicated in practice because banks have diverse assets, deposit structures, hedges, and fee income, but a prolonged inversion can still pressure lending economics and encourage tighter credit standards.
When credit becomes harder to obtain, households may delay major purchases and businesses may postpone investment. Financial stocks can also face pressure because investors anticipate weaker loan growth, greater credit losses, or narrower net interest margins. Fidelity’s banking commentary has identified a steeper curve as a helpful tailwind following prolonged inversion, illustrating why the curve’s shape matters for the sector.
Economic growth and earnings may slow
Stock prices ultimately depend on future cash flows. During an economic slowdown, companies may sell fewer products, experience margin pressure, reduce guidance, and cut investment. Analysts then lower earnings estimates, making previous valuations look overly optimistic.
A stock trading at 25 times expected earnings may seem reasonable when profits are growing 15% annually. It looks much less charming when earnings stop growing or decline. The share price must then adjust to weaker profits, a lower valuation multiple, or both.
Cash and bonds become serious competitors
When short-term Treasury bills offer attractive yields, investors no longer need to accept substantial equity risk to earn a positive return. Cash equivalents, money market funds, and short-term government securities begin competing with stocks for capital.
This competition can weigh especially heavily on expensive growth stocks. A higher risk-free rate reduces the present value of profits expected many years in the future. In plain English, a dollar of hypothetical profit in 2035 becomes less exciting when investors can collect a respectable yield today without needing a company’s visionary founder to deliver 47 consecutive quarters of flawless execution.
Risk appetite can deteriorate quickly
Markets often remain calm while the yield curve is inverted because current economic data may still look healthy. Employment can remain strong, consumer spending can continue, and major stock indexes may reach new highs.
The danger appears when investors conclude that tight policy is no longer merely slowing inflation but damaging growth. Credit spreads may widen, cyclical stocks may weaken, earnings expectations may fall, and volatility may rise. By then, the yield curve’s earlier warning suddenly seems obviousjust as every warning does after the event.
How Reliable Is the Recession Signal?
The inversion’s historical record is strong enough to command attention. Research from the Federal Reserve and Federal Reserve Bank of New York has consistently documented a relationship between the term spread and future recessions. One Federal Reserve discussion noted that, since 1960, the 10-year versus three-month curve produced only one notable signalin 1966that was not followed by an officially declared recession.
However, “often precedes a recession” is not the same as “causes a recession on schedule.” Different maturity spreads may invert at different times. An inversion lasting one trading session may carry less information than a deep, persistent inversion. Changes in inflation, global demand for Treasuries, central-bank asset purchases, financial regulations, and the term premium can also influence the curve.
Federal Reserve researchers have argued that certain near-term forward spreads may provide more direct information about expected monetary policy than traditional long-term spreads. In other words, the famous two-year versus 10-year curve is useful, but it does not deserve a cape, a crystal ball, and its own parking space.
The Timing Problem: Stocks May Rise After an Inversion
The greatest challenge is timing. Yield curve inversions generally occur before economic damage becomes visible, but the delay varies substantially. A Federal Reserve Bank of St. Louis analysis of the 10-year minus one-year spread found historical lags from inversion to recession ranging from roughly eight to 19 months, with an average near 13 months.
That is a wide window. A stock market can accomplish a great deal in 13 months, including setting records, suffering a correction, recovering, and producing enough contradictory commentary to fill several lifetimes.
Stock performance immediately after inversions has not followed a consistent pattern. MSCI research found no clear, dependable path for equities following historical inversions. Dimensional’s examination of developed markets found positive three-year equity returns in 10 of 14 inversion episodes, similar to the general historical frequency of positive three-year returns.
These findings do not mean inversions are harmless. They mean an inversion is better understood as a risk-regime warning than a precise market-timing instruction. Selling every stock on the first inverted day can cause an investor to miss substantial gains. Waiting until a recession is officially announced can be equally unhelpful because stocks often decline before economic agencies confirm the downturn.
Historical Examples Investors Should Understand
The dot-com cycle
Monetary policy tightened in the late 1990s and the yield curve inverted around the peak of the technology bubble. Stocks did not instantly collapse when the curve first inverted. Enthusiasm for internet companies remained intense, valuations stayed elevated, and investors continued chasing businesses whose revenue models sometimes consisted mainly of owning an exciting domain name.
When technology spending weakened and the economic cycle turned, the Nasdaq suffered a severe bear market and the United States entered recession in 2001. The inversion was valuable as an early warning, but it did not provide the exact date when speculative enthusiasm would end.
The 2006–2007 inversion
The Treasury curve inverted before the global financial crisis. At first, many investors argued that strong global savings demand and other structural forces had made the old indicator less relevant. Economic growth continued, unemployment remained relatively low, and stocks rose into 2007.
The problems eventually surfaced through housing, mortgage credit, bank balance sheets, and funding markets. By the time the recession became undeniable, equity prices had already begun responding to a much more serious deterioration in financial conditions.
The 2019 inversion
Parts of the curve inverted in 2019, raising recession concerns. A recession began in early 2020, but the COVID-19 pandemic was an extraordinary external shock. It would be misleading to claim that the curve predicted a global health crisis.
Still, the inversion indicated that markets already expected softer growth and easier future monetary policy. The episode demonstrates both the usefulness and limits of the signal: the curve can identify vulnerability without explaining the precise catalyst that will expose it.
Which Stocks Are Most Vulnerable?
No sector is guaranteed to rise or fall after an inversion, but certain characteristics can increase sensitivity to tight monetary policy and slowing growth.
Highly leveraged companies
Companies with large debts, weak cash flow, or near-term refinancing needs can be vulnerable. Their interest expenses may rise, lenders may impose stricter conditions, and investors may demand a larger risk premium.
Small-cap and cyclical businesses
Smaller companies often have less access to capital markets and more dependence on bank financing. Cyclical industriesincluding discretionary retail, transportation, manufacturing, and constructionmay experience sharp earnings changes when demand slows.
Speculative growth stocks
Companies valued primarily on distant future profits can struggle when interest rates remain high. If those businesses also require continuous outside financing, the combination of expensive capital and weaker investor appetite can be particularly uncomfortable.
Financial companies with weak funding structures
A flat or inverted curve does not hurt every bank equally. Institutions with sticky low-cost deposits, strong capital, diverse revenue, and prudent underwriting may cope well. Those dependent on expensive funding or risky loan categories may face greater pressure.
How Investors Can Respond Without Panicking
The appropriate response is usually not an all-or-nothing bet. An inversion should encourage investors to review portfolio risk, financial resilience, and valuation discipline.
Rebalance instead of predicting the exact top
Investors whose stock exposure has climbed above its intended allocation can rebalance gradually. This approach reduces risk without requiring a dramatic forecast about the date of the next recession or bear market.
Favor financial quality
Strong balance sheets, durable free cash flow, manageable debt, pricing power, and consistent profitability become more valuable as credit conditions tighten. High-quality businesses can still decline during broad selloffs, but they are generally better equipped to survive difficult conditions.
Maintain genuine diversification
High-quality bonds have historically provided useful portfolio ballast during many periods of economic weakness, although they do not protect stocks in every environment. The simultaneous stock-and-bond losses of 2022 showed that diversification is a risk-management tool, not a legally binding promise from the universe.
Watch confirming indicators
The curve is more informative when evaluated alongside credit spreads, unemployment claims, lending standards, manufacturing activity, corporate earnings revisions, housing data, and consumer delinquencies. J.P. Morgan research similarly emphasizes combining the curve with broader indicators rather than allowing one signal to dictate the entire economic outlook.
Avoid emotional portfolio surgery
Investors sometimes respond to alarming headlines by selling diversified holdings, moving entirely into cash, and planning to return when conditions become “clear.” Unfortunately, markets usually recover before economic news feels comfortable. By the time clarity arrives, stock prices may already have moved significantly higher.
Practical Experience: Lessons Investors Learn During an Inversion
The most important experience-based lesson is that a warning signal can be correct without being immediately profitable. An investor may recognize an inversion, reduce risk, and then watch the market rally for another year. That experience is psychologically difficult because caution appears foolish during the final stages of a bull market.
Consider a hypothetical investor named Mark who sees the curve invert and immediately sells his entire stock portfolio. For several months, stocks continue rising as employment remains strong and corporate earnings hold up. Mark becomes frustrated, buys back near a market high, and then experiences the decline he originally feared. His economic interpretation may have been reasonable, but his execution transformed a useful warning into two poorly timed trades.
Another investor, Lisa, responds differently. She checks whether her portfolio has become more aggressive than intended, trims several speculative positions, adds to short-term Treasuries, and maintains her core diversified holdings. She does not attempt to predict the month of the next recession. When volatility arrives, she has liquidity available and does not need to sell long-term investments at distressed prices.
The contrast illustrates why position sizing matters more than dramatic predictions. Experienced investors generally learn that risk management should prepare a portfolio for multiple outcomes. The economy may enter recession, achieve a soft landing, or remain surprisingly resilient. Inflation may fall quickly, remain sticky, or return after markets have already celebrated its funeral.
Investors also learn to distinguish between the first inversion and the later steepening of the curve. A curve may steepen because the outlook improves and long-term yields rise. It may also steepen because the Federal Reserve cuts short-term rates as economic conditions deteriorate. The same chart shape can therefore carry very different meanings depending on why yields are moving.
Another practical lesson concerns market concentration. Major indexes may remain strong even while economically sensitive stocks, small companies, banks, and unprofitable businesses weaken. A handful of giant corporations can conceal deterioration beneath the surface. Watching market breadth, earnings revisions, and credit conditions can reveal stress that the headline index temporarily hides.
Finally, seasoned investors respect uncertainty. They do not dismiss the inversion because “this time is different,” but they also do not assume every historical relationship must repeat perfectly. They create a portfolio that can endure disappointment, maintain enough liquidity for foreseeable needs, and avoid leverage that could force selling at the worst possible moment.
The goal is not to win an argument about whether recession begins in nine, 13, or 18 months. The goal is to remain financially capable of participating in the recovery whenever it arrives. Markets have a mischievous habit of rewarding patience immediately after testing it to the point of exhaustion.
Conclusion
Yield curve inversions are not great for stocks because they often reflect restrictive monetary policy, expectations of slower growth, tightening credit, and the possibility of weaker corporate earnings. Their historical association with recessions is too significant to ignore.
However, an inversion is not a countdown clock. Stocks can rise substantially after the curve first turns negative, and the lag before a recession or market decline can vary widely. Some inversions may also reflect changes in term premiums, global bond demand, or other forces that weaken the traditional message.
The sensible response is neither complacency nor panic. Investors can use the signal to rebalance, improve portfolio quality, reduce excessive leverage, maintain diversification, and monitor confirming economic indicators. The yield curve may not tell investors exactly when trouble will arrive, but it often suggests that checking the financial weather forecast would be a very good idea.
Note: This article is provided for educational purposes and should not be considered personalized investment, tax, or financial advice.