

A 50/50 stock-and-bond portfolio sounds reassuringly balanced. Half the money pursues growth, while the other half is supposed to provide income, stability, and a soft place to land when stocks trip over their own shoelaces.
Usually, that arrangement works reasonably well. But “usually” is not the same as “always.” During several historical periods, a balanced portfolio produced disappointing nominal returns and even worse inflation-adjusted results. Investors saw account balances that appeared stable while their purchasing power quietly slipped out the back door.
Understanding the worst 50/50 stock/bond real returns is therefore not an exercise in financial pessimism. It is a practical way to learn what diversification can accomplish, where it can fail, and how investors can prepare for periods when stocks, bonds, and inflation all decide to become difficult at the same time.
What Is a Real Return?
A nominal return measures how many dollars an investment gained or lost. A real return measures how much purchasing power those dollars gained or lost after inflation.
The simplified calculation is:
Real return = (1 + nominal return) ÷ (1 + inflation rate) − 1
Suppose a portfolio earns 5% while inflation is 7%. The investor has more dollars, but those dollars buy less. The approximate real return is negative 2%.
This distinction becomes especially important over long periods. A portfolio growing at 4% annually may appear respectable. If consumer prices are rising at 5%, however, the portfolio is slowly losing the ability to pay for housing, groceries, health care, travel, and the occasional overpriced airport sandwich.
The Consumer Price Index measures changes in the prices paid by urban consumers for a broad basket of goods and services. Historical CPI data allow nominal investment returns to be translated into purchasing-power results.
How the Historical 50/50 Portfolio Is Measured
For this analysis, the hypothetical portfolio holds:
- 50% in the S&P 500, including reinvested dividends
- 50% in 10-year U.S. Treasury bonds
- Annual rebalancing back to the 50/50 target
- Inflation adjustments based on U.S. consumer-price data
The calculations use annual U.S. stock, Treasury bond, and inflation data beginning in 1928. The precise results will vary when researchers use different bond indexes, monthly rather than annual rebalancing, rolling monthly periods, investment fees, or alternative inflation measurements. Nevertheless, the broader historical pattern is remarkably clear: prolonged inflation has been the most dangerous environment for real balanced-portfolio returns.
Why Annual Rebalancing Matters
Without rebalancing, the better-performing asset gradually takes over the portfolio. A 50/50 allocation could become 70/30 after a long stock-market rally. Annual rebalancing keeps the risk profile closer to the original design by selling some of the winner and buying some of the laggard.
That process can improve discipline, but it is not magical. Rebalancing cannot transform two falling assets into a rising portfolio. When stocks and bonds decline together, the investor is essentially choosing which unpleasant entrée to order twice.
The Worst 10-Year Real Returns for a 50/50 Portfolio
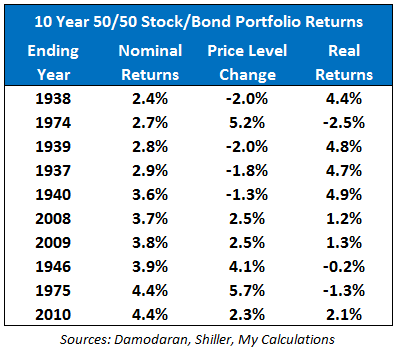
A reconstruction using calendar-year stock, 10-year Treasury, and inflation data produces the following selected poor 10-year periods. The annualized return is the approximate compound real return after inflation.
| 10-Year Period | Annualized Real Return | Real Value of an Initial $10,000 | Primary Problem |
|---|---|---|---|
| 1972–1981 | About -2.9% | About $7,420 | Persistent inflation, recessions, and rising rates |
| 1965–1974 | About -2.4% | About $7,830 | Great Inflation and the 1973–1974 bear market |
| 1969–1978 | About -2.2% | About $8,040 | Stagflation and weak bond purchasing power |
| 1966–1975 | About -1.7% | About $8,410 | Inflation, recession, and falling equity valuations |
| 1973–1982 | About -1.7% | About $8,440 | Oil shocks, inflation, and aggressive monetary tightening |
| 1937–1946 | About -0.6% | About $9,420 | Stock losses followed by wartime inflation |
These figures should be treated as historical estimates rather than returns from an investable fund. Index selection and calculation methods can move the numbers. The important lesson is not whether the worst result was negative 2.8% or negative 3.0%. The important lesson is that a diversified portfolio could lose roughly one-quarter of its purchasing power over an entire decade.
The Brutal 1972–1981 Period
The 1972–1981 window was especially painful because inflation attacked both sides of the portfolio.
Stocks struggled with recessions, energy shortages, falling valuations, and uncertain corporate profits. Traditional bonds were also vulnerable because their fixed payments became less valuable as consumer prices rose. Meanwhile, rising interest rates pushed existing bond prices downward.
The Great Inflation lasted from approximately 1965 to 1982. It included four recessions, energy shortages, wage and price controls, and enormous changes in monetary policy. U.S. inflation rose from approximately 1.6% in 1965 to 13.5% in 1980.
For an investor living through the period, the experience was more discouraging than a single crash. There was no dramatic one-day event after which everything quickly returned to normal. Purchasing power was eroded year after year, like a tiny subscription charge nobody remembered authorizing.
The 1965–1974 Lost Decade
An investor beginning in 1965 entered the market when stock valuations were relatively optimistic and inflation was still modest. Over the following decade, inflation accelerated, the Bretton Woods monetary system unraveled, oil prices surged, and the 1973–1975 recession arrived.
The nominal portfolio result did not look as catastrophic as the Great Depression. After inflation, however, an initial $10,000 had purchasing power of only about $7,830 by the end of 1974 in this reconstruction.
The National Bureau of Economic Research dates the major recession of this period from November 1973 through March 1975. It was one of several downturns that complicated the Great Inflation era.
The Surprising 20-Year Result
Long holding periods normally improve the odds of earning a positive real return. Yet the 20-year period from 1962 through 1981 was still slightly negative in this particular 50/50 reconstruction, at approximately negative 0.4% annually after inflation.
An inflation-adjusted $10,000 would have ended with purchasing power of roughly $9,270 after two decades. The account may have shown a much larger nominal balance, but the real economic reward was essentially twenty years of running on a treadmill while wearing expensive financial shoes.
Why the Great Depression Was Different
The stock-market losses of the early 1930s were far more dramatic than those of the 1970s. Yet some Depression-era balanced-portfolio periods look less terrible after inflation than their nominal results might suggest.
The reason was deflation. Consumer prices fell during several years of the Great Depression. Declining prices increased the purchasing power of every surviving dollar and made the fixed payments from high-quality bonds more valuable in real terms.
Deflation was certainly not pleasant for the economy. It was associated with falling wages, unemployment, defaults, and severe financial stress. From the narrow perspective of an investor who continued holding Treasury securities, however, deflation provided a real-return tailwind.
Inflation and deflation therefore affect bonds in opposite ways. Unexpected inflation punishes fixed nominal payments, while deflation increases their purchasing power. This is why the worst nominal portfolio period is not automatically the worst real portfolio period.
Why 2022 Shocked Balanced-Portfolio Investors
For several decades before 2022, investors became accustomed to bonds cushioning major stock-market declines. That pattern was especially visible during growth scares and recessions, when interest rates often fell and Treasury prices rose.
Then 2022 arrived carrying a folding chair.
Inflation surged, central banks raised interest rates, stock valuations contracted, and bond prices fell sharply. In the stock-and-Treasury dataset used for this article, a 50/50 portfolio lost roughly 18% nominally and approximately 23% after inflation during 2022.
Other index combinations produce somewhat different figures. Morningstar calculated that a representative 60/40 portfolio declined about 15.3% in 2022, while its U.S. core bond index lost 12.9%, its worst calendar-year performance in the available history. The episode showed that bonds can reduce equity risk without eliminating interest-rate or inflation risk.
Unlike the 1970s, 2022 was initially a one-year shock rather than a lost decade. It still offered the same warning: stock-and-bond diversification is a risk-management tool, not a contractual guarantee that one asset must rise whenever the other falls.
Why Stocks and Bonds Sometimes Fall Together
Inflation Can Hurt Both Assets
Moderate inflation can be manageable for businesses, especially when companies can raise prices. Unexpected or persistent inflation is more disruptive. It can increase costs, pressure profit margins, produce tighter monetary policy, and reduce the present value investors assign to future earnings.
For conventional bonds, the problem is direct. A bond promising fixed payments becomes less attractive when inflation rises or newly issued bonds offer higher yields. Its market price generally falls to compensate.
Rising Rates Reduce Existing Bond Prices
Bond prices and yields move in opposite directions. Longer-duration bonds are especially sensitive to rate changes because investors must wait longer to receive much of their cash flow.
A bond allocation dominated by long maturities can therefore be more volatile than investors expect. The word “bond” sounds calm and responsible, but a long-duration bond fund can still produce an alarming statement at the end of the month.
Starting Valuations Matter
When stocks begin at expensive valuations, future returns may be more vulnerable to disappointment. When bond yields begin at unusually low levels, investors receive less income and have less protection against rising rates.
A balanced allocation may still be appropriate, but the range of plausible outcomes changes with starting prices, yields, inflation expectations, and economic conditions.
Correlation Is Not Permanent
The relationship between stocks and bonds changes across economic regimes. Bonds tend to diversify stocks effectively when recessions and falling growth are the dominant risks. They may provide less protection when inflation is the main threat because rising prices and rising interest rates can pressure both assets simultaneously.
Recent investment research continues to describe bonds as an important source of income and risk reduction, while also recognizing that inflationary and supply-driven shocks can weaken the traditional stock-bond relationship.
What the Worst Real Returns Teach Investors
Measure Progress in Purchasing Power
Investors should compare long-term portfolio growth with inflation and personal spending needs. A rising account balance is not sufficient if the cost of the desired lifestyle is increasing faster.
Retirees may experience a personal inflation rate that differs from headline CPI because health care, housing, insurance, and travel may represent larger portions of their spending.
Do Not Abandon Diversification After It Disappoints
Diversification occasionally fails over short or intermediate periods. That does not make it useless. Fire extinguishers also spend most of their lives doing nothing, but throwing one away because the kitchen has not burned recently would be an unusual interpretation of risk management.
Historical evidence from Vanguard shows that increasing the stock allocation generally raises both expected return and the range of possible gains and losses. Balanced portfolios trade some upside potential for a historically narrower range of outcomes.
Remember That Bonds Are Not One Homogeneous Asset
A bond allocation can include short-term Treasuries, intermediate government bonds, corporate debt, municipal bonds, Treasury Inflation-Protected Securities, and international bonds. Each has different exposure to inflation, interest rates, credit conditions, and currency movements.
Shorter-duration bonds generally have less sensitivity to rising rates. High-quality government bonds may offer better protection during recessions. Corporate bonds provide additional yield but can behave more like stocks during credit crises.
Consider Inflation-Protected Assets
Treasury Inflation-Protected Securities, commonly called TIPS, adjust their principal according to changes in CPI. Interest payments are calculated using the inflation-adjusted principal, and at maturity the Treasury pays the greater of the original or adjusted principal.
TIPS are not guaranteed to rise every year, especially when real yields change. They do, however, address inflation risk more directly than conventional fixed-rate Treasury bonds.
Prepare for Sequence-of-Returns Risk
Poor returns are most damaging when an investor must make withdrawals. A retiree selling assets during a prolonged decline removes capital that would otherwise participate in a recovery.
This is known as sequence-of-returns risk. Two investors can earn similar average returns but experience very different outcomes because one suffers losses near the beginning of retirement. Maintaining a reasonable cash reserve, controlling withdrawals, and periodically rebalancing can reduce the need to sell depressed assets.
Is a 50/50 Portfolio Better Than a 60/40 Portfolio?
Neither allocation is universally better. A 50/50 portfolio has more bonds and will usually be somewhat less sensitive to stock-market movements than a 60/40 portfolio. It may suit an investor with moderate risk tolerance, a shorter horizon, or a greater need for stability.
A 60/40 portfolio has more exposure to equities and therefore greater long-term growth potential, along with deeper possible losses. Younger investors with stable income may prefer more than 60% in stocks, while retirees with near-term spending needs may require more bonds and cash.
The decision should depend on financial goals, withdrawal needs, time horizon, income stability, and the investor’s ability to remain invested during losses. A theoretically perfect allocation is useless when its owner panic-sells after the first ugly quarter.
Common Mistakes When Evaluating Balanced-Portfolio Returns
Looking Only at Average Returns
Long-term averages hide the order in which returns occurred. A decade of weak returns followed by a strong recovery can be manageable for a young saver but devastating for a retiree withdrawing money throughout the weak period.
Ignoring Taxes and Investment Costs
Historical index returns typically exclude advisory fees, fund expenses, trading costs, and individual taxes. These expenses reduce the return investors actually keep. During a low-return decade, even modest costs consume a larger share of the result.
Assuming Recent Correlations Will Continue Forever
Investors often build expectations from the previous ten or twenty years. Unfortunately, markets are under no obligation to repeat the environment that made a strategy look attractive in a backtest.
Changing the Allocation After Losses
Switching to cash after both stocks and bonds have fallen can lock in losses and eliminate participation in a recovery. Market timing is particularly difficult because strong and weak trading days often occur close together.
Investor Experiences From the Worst 50/50 Stock/Bond Periods
The hardest part of a bad balanced-portfolio period is not always the size of the decline. It is the gap between expectation and reality.
An investor who owns aggressive stocks understands that a 30% decline is possible. A person choosing a 50/50 portfolio often expects a calmer experience. When both halves decline, the emotional reaction can be stronger because the portfolio appears to have broken its promise.
Experience 1: The Loss Feels Unfair
During an ordinary stock bear market, investors can look at their bonds and see at least one part of the plan working. During an inflation-driven decline, that comfort disappears. The stock fund is down, the bond fund is down, and the grocery bill has somehow developed the confidence of a luxury brand.
This combination can lead investors to conclude that diversification has failed permanently. Historically, however, the stock-bond relationship has changed repeatedly. A difficult year or decade does not prove that the allocation lacks long-term value; it proves that diversification manages risk rather than abolishing it.
Experience 2: Inflation Is Less Visible Than a Market Crash
A market decline is obvious. Investors can see a red number on a brokerage statement. Inflation works more quietly. The account may recover in nominal dollars while its ability to finance real expenses remains impaired.
This creates a dangerous sense of progress. An investor might celebrate a portfolio increasing from $500,000 to $600,000 without noticing that the cost of the intended retirement lifestyle has risen from $40,000 to $52,000 per year.
Reviewing financial plans in real dollars makes the experience more honest. It also helps investors adjust savings rates, spending assumptions, and retirement dates before a purchasing-power shortfall becomes an emergency.
Experience 3: Rebalancing Feels Wrong at Exactly the Right Time
Rebalancing often requires buying whichever asset has recently produced the most disappointing headlines. After a stock decline, investors must sell some relatively stable bonds and buy stocks. After a bond crash, they may need to direct new money into bond funds that appear determined to ruin every dinner conversation.
The process feels uncomfortable because recent performance influences expectations. Yet maintaining the target allocation prevents fear from quietly redesigning the portfolio. Rebalancing should be systematic, tax-aware, and based on predetermined thresholds rather than daily market noise.
Experience 4: Cash Flow Changes Everything
An accumulating investor can treat falling markets as an opportunity to purchase assets at lower prices. A retiree making withdrawals faces a different experience. Selling investments after a real decline may permanently reduce the number of shares available for the eventual recovery.
Retirees commonly benefit from separating near-term spending from long-term growth assets. Holding a practical reserve of cash and short-term high-quality bonds can provide time for riskier assets to recover. The correct reserve depends on spending flexibility, pensions, Social Security, tax considerations, and other income.
Experience 5: The Best Portfolio Is the One an Investor Can Keep
Historical optimization can identify portfolios with attractive returns, volatility, or withdrawal success rates. It cannot fully measure human behavior.
Some investors can tolerate a 70/30 allocation without losing sleep. Others will sell after a 12% decline and then wait three years for a reassuring headline. For the second investor, a more conservative portfolio may produce a better real-world result even if its theoretical expected return is lower.
The practical experience of owning a 50/50 portfolio is therefore a test of patience as much as mathematics. Successful investors understand what could go wrong before it happens, maintain enough liquidity to avoid forced selling, and use a portfolio aligned with their actual behavior rather than their heroic imaginary behavior.
Conclusion
The worst 50/50 stock/bond real returns occurred when persistent inflation, rising interest rates, recessions, and weak stock valuations arrived together. In the most difficult historical 10-year windows, a balanced U.S. portfolio lost roughly 2% to 3% of purchasing power annually. One especially poor 20-year period also finished slightly negative after inflation.
Those results do not mean balanced portfolios are defective. They show that no two-asset strategy can protect against every economic regime. Stocks provide growth but can suffer during recessions and valuation contractions. Conventional bonds provide income and stability but remain exposed to inflation and rising rates.
A resilient plan may combine broad equity diversification, high-quality bonds of appropriate duration, inflation-protected securities, sufficient liquidity, controlled costs, disciplined rebalancing, and realistic withdrawal assumptions. Most importantly, investors should evaluate progress in purchasing power rather than nominal dollars.
The historical record offers both a warning and reassurance. A 50/50 portfolio can endure deeply frustrating periods, but abandoning a sensible allocation after losses often turns a temporary problem into a permanent one. Balanced investing has never promised a smooth ride. It simply gives the vehicle more than one wheelwhich remains useful, even when the road is doing its best impression of the 1970s.