

Let’s start with an uncomfortable truth: calling a market a “bubble” is like calling a movie “overrated” in a group chat. Someone will agree, someone will fight you, and at least one person will reply with a meme and no explanation.
But valuations aren’t vibes. Valuations are math wearing a suit… and sometimes that suit is tailored, and sometimes it’s a clown costume with “THIS TIME IS DIFFERENT” stitched on the back. The question “Are we at bubble-level valuations?” deserves a real answer built on data, history, and a little humilitybecause markets can stay irrational longer than most people can stay patient (or solvent).
In this article, we’ll look at where U.S. valuations sit right now, what “bubble-level” actually means, the strongest arguments on both sides, and a practical framework for spotting when “expensive” turns into “uh-oh.”
What “Bubble-Level” Actually Means (Hint: It’s Not Just “Prices Are High”)
“Bubble” isn’t a synonym for “stocks went up.” A bubble is usually a cocktail of three ingredients:
- Stretched valuations relative to history (prices rise faster than fundamentals).
- Heroic expectations (future growth has to be nearly perfect to justify today’s price).
- Behavioral heat (leverage, speculation, and FOMO-driven narratives that replace analysis).
In other words: high valuations can be normal. Bubble-level valuations are high valuations plus a market mood that says, “Risk is canceled. Everyone wins. Please ignore gravity.”
Where We Are Now: A Valuation Reality Check
Valuation is a multi-tool, not a single number. So here’s a scorecard approachseveral widely used indicators that help triangulate whether the market is merely pricey or potentially bubbly.
1) Forward P/E: Expensive, Not Unprecedented
The forward price-to-earnings ratio (forward P/E) asks: “How many dollars are investors paying today for next year’s expected earnings?”
Recent S&P 500 data show a forward P/E in the low 20s. That’s rich by long-run standards, especially compared with decades when the market often traded in the mid-teens. But it’s also not automatically dot-com territory, when parts of the market were priced as if profits were optional.
Translation: forward P/E says “expensive.” It doesn’t scream “inevitable crash,” but it does whisper “future returns may be… less exciting.”
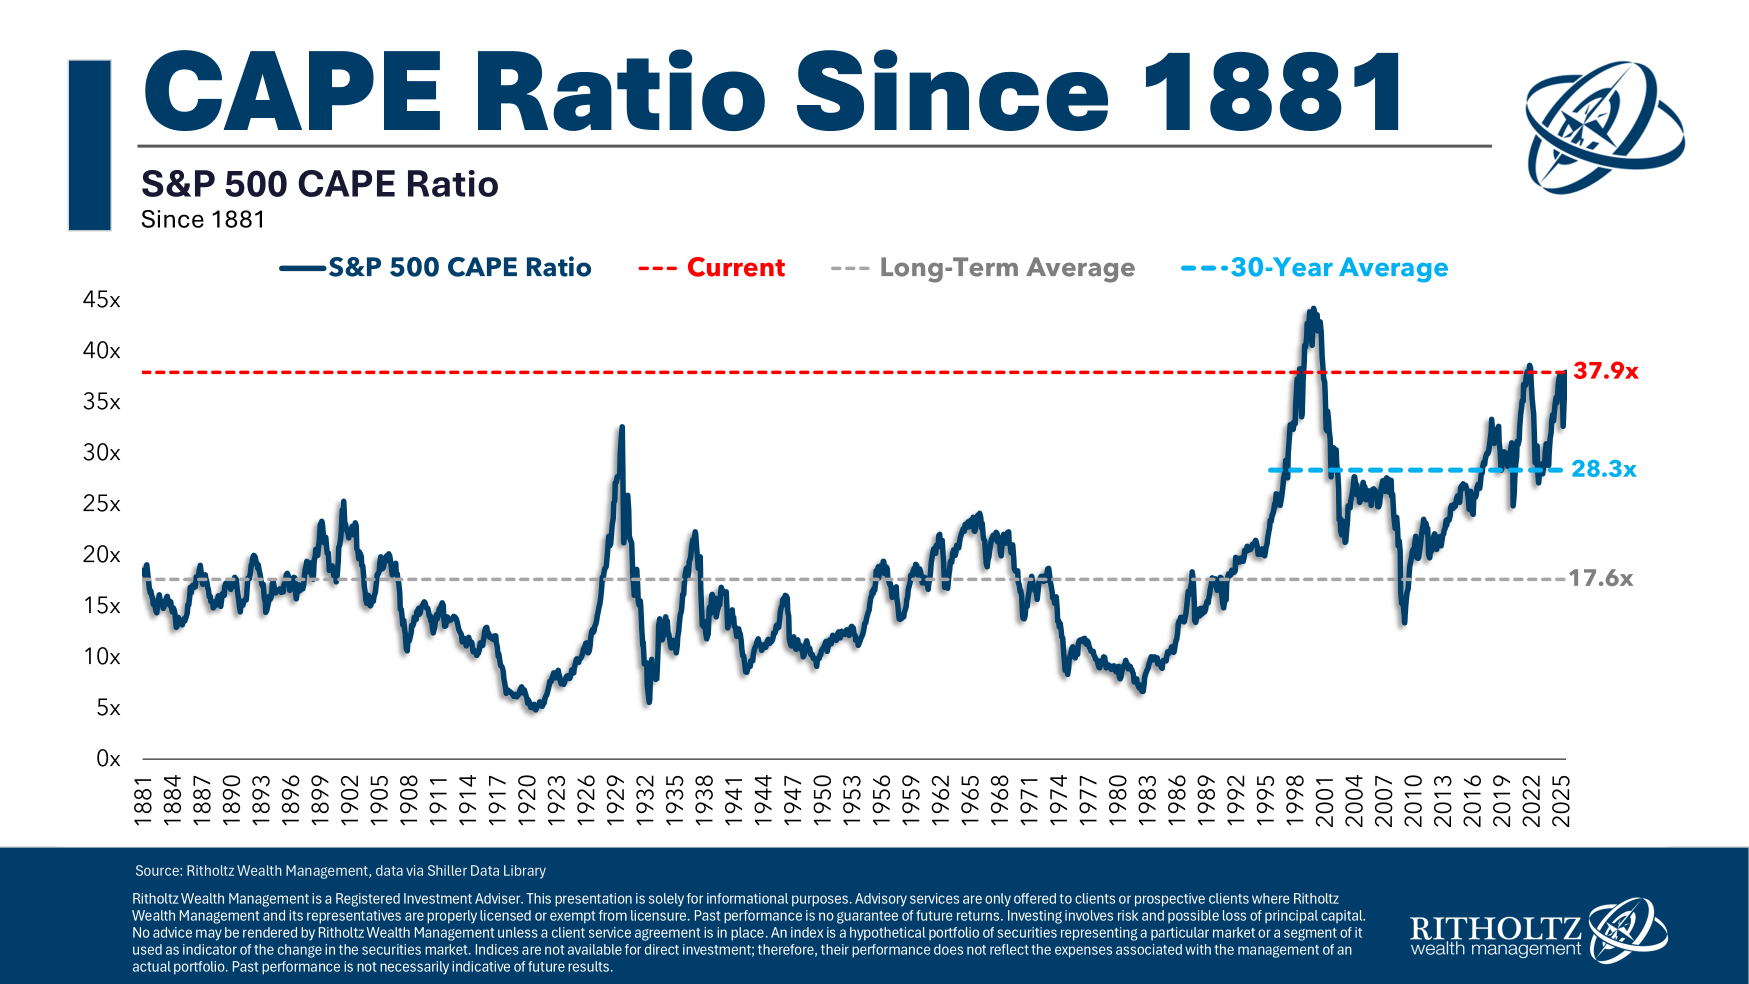
2) Shiller CAPE: The “Long Memory” Metric Is Flashing Hot
The Shiller CAPE (cyclically adjusted P/E) uses inflation-adjusted earnings averaged over 10 years. It’s designed to smooth out booms and busts in profits.
When CAPE is high, it often signals that investors are paying a premium compared to a long baseline of corporate earnings power. CAPE is especially useful for long-term contextand right now, it’s in historically elevated territory.
One way to express the same idea is the Shiller cyclically adjusted earnings yield (the inverse of CAPE). When the earnings yield is low, prices are high relative to long-run earnings. Today’s cyclically adjusted earnings yield is far below its long-term averagemeaning investors are accepting a thinner stream of “normalized” earnings for each dollar invested.
3) Market Cap-to-GDP (The “Buffett Indicator”): Elevated, With a Warning Label
This indicator compares the total value of the U.S. stock market to the size of the U.S. economy. Think of it as: “How big is Wall Street compared to Main Street’s entire annual output?”
When market cap-to-GDP is very high relative to history, it suggests the market may be priced aggressively compared to the underlying economic base. It’s not perfect (global revenue, profit margins, and globalization complicate it), but it’s a blunt tool that has historically been useful for spotting extremes.
4) Interest Rates: The “Discount Rate” Matters More Than Your Feelings
Valuations don’t live in a vacuum. Higher interest rates raise the discount rate used to value future cash flows, which tends to pressure P/E multiples. Lower rates do the opposite.
Right now, longer-term yields are meaningfully positive and not “free money” levels. That matters because it changes the competition: investors can get a non-trivial yield from safer assets, so stocks have to earn their keep.
5) Risk Appetite Signals: Credit Spreads, Leverage, and “YOLO Instruments”
Bubble-like markets often show up in behavior before they show up in headlines.
- Credit spreads (like high-yield spreads) tend to tighten when investors feel fearless.
- Margin debt tends to rise when investors borrow more to buy stocks.
- Very short-dated options can surge when speculation heats upbecause nothing says “I’ve thoughtfully assessed my risk tolerance” like betting on what happens before dinner.
These indicators don’t prove a bubble on their own, but they help answer the crucial question: is today’s valuation supported by disciplined capital… or by increasingly fragile positioning?
The Case for “Yes, This Looks Bubble-ish”
High Valuation Metrics Stack Up at Once
One of the most concerning patterns in true bubbles is when multiple valuation measures line up at historically elevated levels simultaneously. If forward P/E is high, CAPE is high, and market cap-to-GDP is high, the market is no longer “a little expensive.” It’s expensive in stereo.
That doesn’t guarantee an imminent crash, but it does suggest the market is priced for a lot of good newsand priced in a way that leaves less room for disappointment.
Concentration Risk: “The Index” Isn’t Always Diversified
Another bubble-adjacent feature is heavy concentration in a small group of mega-cap winners. When a handful of companies drive a large share of index performance, the index can look strong even if many stocks are merely okay (or quietly struggling behind the curtain).
This matters because concentrated markets can be more fragile. If a few dominant names stumbleearnings miss, regulation changes, demand slowsthe whole index can feel it, even if most companies are doing fine.
Speculation Has More Than One Costume
Speculation doesn’t always look like day traders screaming into webcams (though that can happen). In modern markets it can show up as:
- Heavy activity in ultra-short-dated options
- Investors treating “narrative” as a substitute for cash flow
- Rising leverage (margin debt) during strong bull runs
- Sentiment readings that stay unusually optimistic for long stretches
If the market’s emotional temperature rises while valuations are already stretched, that’s when “expensive” starts flirting with “bubble.”
AI Hype Can Be Real… and Still Get Overpriced
One of the hardest things about bubbles is that they often form around something true. The internet changed the world. Housing is important. AI is transformative. The bubble part is when investors pay any price for a true story.
When capital spending surges and expectations rise, the market can start pricing in best-case outcomesfast adoption, huge margins, limited competition, and smooth regulationsimultaneously. That’s a lot of perfection to demand from reality, which famously does not read your spreadsheets.
The Case for “Not Necessarily a Bubble”
Valuations Don’t Predict Next MonthThey Predict the Next Decade (Roughly)
Valuations are better at explaining long-term return potential than short-term market moves. A high CAPE can persist for years. A pricey market can get pricier. Anyone who has ever tried to short “overvalued” stocks knows the emotional journey: confidence → confusion → bargaining → acceptance → deleting the app.
So even if valuations are high, “bubble” implies fragility and eventual mean reversion. The timing is notoriously unpredictable.
Earnings Expectations Are Strong (And Profits Are Real)
Unlike some classic bubbles where profits were hypothetical, today’s market leadership includes companies producing enormous cash flows. Analysts also expect meaningful earnings growth over the coming year in aggregate, which helps justify higher multiples.
If earnings growth is strong enoughand stays strongthen some of today’s valuation pressure can “wash out” over time as profits catch up with prices.
The Market Composition Has Shifted Toward Intangibles
Modern U.S. markets are dominated by businesses built on software, platforms, networks, and intellectual propertyassets that don’t always show up neatly on balance sheets. Traditional valuation metrics may understate the durable economics of companies whose “factories” are data centers and whose “inventory” is code.
That doesn’t mean valuations can’t be excessive. It means the old yardsticks sometimes need context, especially when comparing today to eras dominated by heavy industry.
Global Capital Treats U.S. Equities as the “Default” Risk Asset
U.S. markets often attract global capital because of liquidity, rule of law, and the dominance of U.S. multinational earnings. That persistent demand can support higher valuations than history alone might suggestespecially if investors view U.S. equities as the “least-worst” option in a messy world.
A Practical Bubble-Check Framework (Use This Instead of Doomscrolling)
If you want a usable way to think about bubble-level valuations, ask five questions. You don’t need all five to be “yes,” but the more you check off, the more bubble risk rises.
1) Are prices outrunning fundamentals?
Look for long stretches where price gains far exceed earnings growth. Multiple expansion can be rational for a whilebut if it becomes the main engine of returns, the market gets more sensitive to disappointment.
2) Are expectations becoming heroic?
In bubble-ish markets, the implied story becomes: “Growth will be fast, margins will be huge, competition will be mild, and everything will go right.” That’s not a forecast. That’s a wish list.
3) Is the market narrow?
Broad bull markets tend to be healthier. Narrow leadership can still be legitimate, but it increases fragilityespecially when the leaders carry premium valuations.
4) Is easy financing feeding speculation?
Watch credit spreads, margin debt, and the popularity of leveraged or ultra-short-term trading vehicles. When risk-taking becomes “normal,” it’s often a late-cycle signal.
5) Are narratives replacing numbers?
Innovation matters. Stories matter. But when investors stop asking “how does this generate cash?” and start asking “how many users will love it?” you’re in dangerous territory.
So… Are We at Bubble-Level Valuations?
Here’s the most honest answer: the U.S. market looks richly valued, and several long-horizon indicators are in historically elevated territory. That’s a real warning sign for long-term return potential.
But calling it a full-blown bubble requires more than “expensive.” It requires widespread fragilityextreme leverage, euphoric behavior, and pricing that depends on perfect outcomes. We do see elements of speculative behavior (especially in derivatives activity and the way mega-cap narratives dominate), but we also see something bubbles often lack: real earnings power and large companies that are not just “promise factories.”
A fair verdict is:
- Valuations: elevated.
- Concentration risk: elevated.
- Speculative behavior: present (not universal, but meaningful).
- Fundamentals: stronger than classic “profits optional” bubbles.
If you’re looking for a single sentence: We’re in “priced-for-perfection” territorybubble-adjacent, even if not pure bubble.
What to Do With This Information (Without Becoming the Fun Police)
This isn’t personal financial advice, but it is practical risk management:
- Expect lower forward returns when starting valuations are high. Not negative returnsjust potentially more “meh.”
- Respect concentration: if your “diversified” index fund is heavily tilted to a few names, recognize what you own.
- Rebalancing beats prediction: trimming what grew a lot and adding to what lagged is boring, and boring is often effective.
- Avoid leverage you can’t afford: bubbles hurt most when people are forced sellers.
- Stay curious about fundamentals: earnings quality, free cash flow, and competitive dynamics matter more when valuations are tight.
Valuations are like weather forecasts: they won’t tell you exactly what happens tomorrow, but they’re excellent at warning you when you probably shouldn’t schedule a beach day without a backup plan.
Experiences Related to Bubble-Level Valuations (500+ Words of “I’ve Seen This Movie Before” Energy)
Even without living through every market cycle personally, you can learn a lot from the repeating pattern of how investors tend to behave when valuations get stretched. The details changedot-com websites become AI platforms, meme stocks become “zero-day” tradesbut the emotional rhythm is remarkably consistent.
The FOMO Phase: “I’m Not Greedy, I’m Just… Late”
A common experience in expensive markets is the slow creep of FOMO. At first, people feel cautious: “These prices seem high.” Then the market keeps going up anyway, and caution turns into curiosity: “Am I missing something?” Finally, curiosity becomes participation: “Okay, just a small position.”
What’s interesting is how often this happens after big gains have already occurred. Investors don’t usually jump in at the first sign of opportunity. They jump in when the opportunity has been socially validatedby headlines, group chats, and that one person who won’t stop posting screenshots of their portfolio like it’s a Michelin-star meal.
The Narrative Upgrade: “This Isn’t ExpensiveIt’s the Future”
As valuations rise, the story often evolves. Early on, the story is grounded: “This company is growing fast.” Later, it becomes philosophical: “This company is redefining the economy.” And near the top, it becomes spiritual: “Valuations don’t apply anymore.”
This is where people experience a subtle shift: they stop looking for evidence and start looking for confirmation. Metrics that used to matterprofit margins, competitive threats, cash flowget waved away as “old thinking.” That’s not always wrong (innovation really can change economics), but it’s a risk when it becomes an excuse to pay any price.
The Concentration Surprise: “Wait… My Index Fund Is What Now?”
Many investors have a moment of realization in concentrated markets: the index feels diversified, but performance may hinge on a handful of giants. The experience is often confusing because the account statement says “S&P 500,” which sounds like 500 separate engines pulling the train. In reality, it can feel like seven engines sprinting while the rest jog behind them.
This doesn’t mean owning an index is “bad.” It means investors sometimes underestimate the role of leadership risk. When a few names get very large, owning the index becomes, in part, owning those nameswhether you intended to or not.
The Volatility Wake-Up: “Oh. So Stocks Can Go Down.”
Another common experience comes when reality interrupts the story: a growth scare, a rate spike, an earnings miss, a regulatory headline. In expensive markets, the surprise isn’t always the newsit’s the market’s sensitivity to the news. A modest disappointment can trigger a big reaction because the price already assumed perfection.
This is often when people learn the difference between a great company and a great stock. A business can be strong, innovative, and profitable… and still be overpriced if expectations got too ambitious.
The Best Lesson: “You Don’t Have to PredictYou Have to Prepare”
One of the healthiest takeaways from bubble-adjacent periods is that you don’t need a crystal ball; you need a plan. Investors who handle expensive markets well typically do a few simple things: they avoid over-leverage, they diversify, they rebalance, and they keep their time horizon honest.
That’s not as thrilling as calling the top. But it’s more likely to keep you in the gamewhich is the whole point. Because the market doesn’t give trophies for being right early. It rewards staying solvent and staying invested in a way you can live with.