

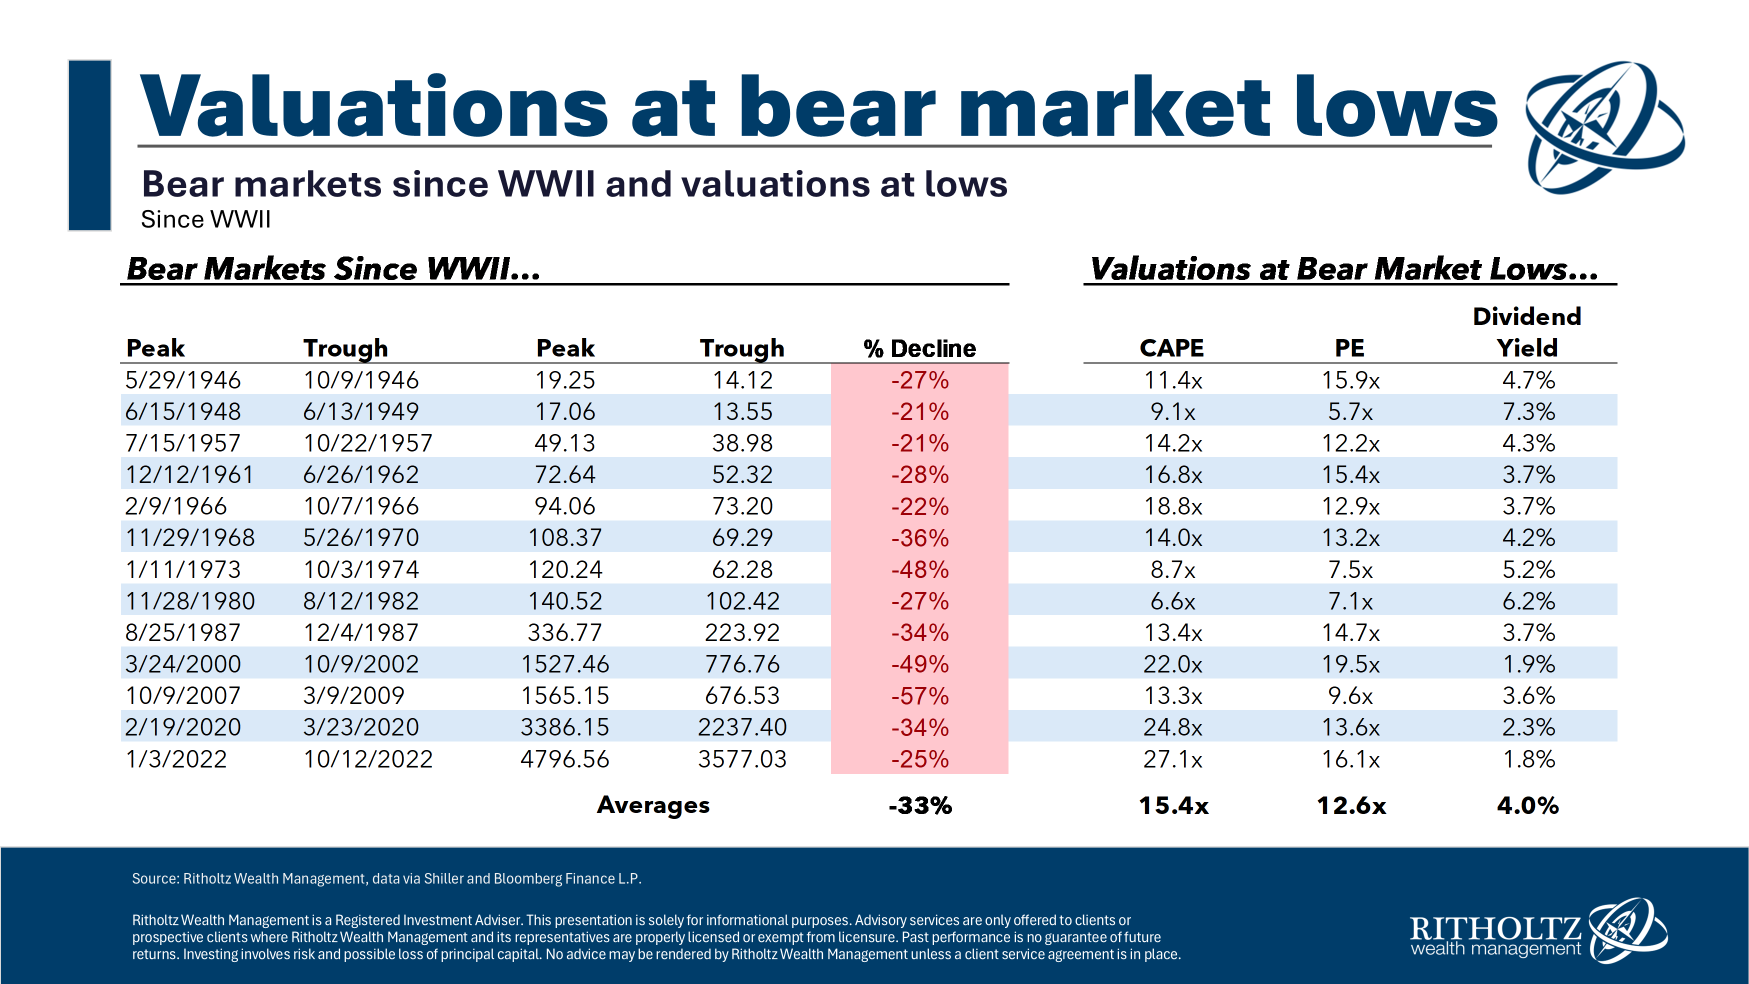
Investors have spent generations searching for a reliable way to buy near market bottoms and sell before the crowd discovers gravity. Valuation ratios appear to offer exactly that: a numerical signal telling us whether stocks are cheap, expensive, or priced as though recessions have been permanently canceled.
Unfortunately, the stock market does not come with a clearly labeled “fair value” switch. Valuations can help estimate long-term return potential, identify unusually attractive opportunities, and improve portfolio decisions. They are much less effective at predicting whether stocks will rise or fall next Tuesday.
The practical goal, therefore, is not to use valuations as a magical market-timing indicator. It is to use them as part of a disciplined investment processone that adjusts expectations and risk without requiring clairvoyance, perfect emotional control, or a time machine.
What Does Timing the Stock Market Using Valuations Mean?
Stock market valuation compares the price investors are paying with some measure of underlying economic value. That measure might be corporate earnings, sales, dividends, book value, cash flow, or the size of the broader economy.
When prices rise much faster than fundamentals, valuation multiples expand. Investors are paying more for each dollar of earnings or revenue. When prices fall or fundamentals improve, multiples contract, potentially making stocks more attractive.
A valuation-based market timing strategy attempts to reduce stock exposure when the market looks expensive and increase exposure when it looks cheap. The idea is logical: buy more when expected returns are generous and less when the margin of safety has become thin.
The trouble is that an expensive market can become dramatically more expensive before falling. A cheap market can become cheaper while investors discover several exciting new definitions of the word “panic.” Valuation is better at describing the investment climate than forecasting tomorrow’s weather.
Why Valuations Matter More Over Long Time Horizons
Over short periods, stock prices are influenced by earnings surprises, interest-rate expectations, geopolitical events, investor positioning, liquidity, and sentiment. Over longer periods, the price paid for a stream of corporate earnings becomes much more important.
Research using the cyclically adjusted price-to-earnings ratio, or CAPE ratio, has found that higher starting valuations have generally been associated with lower subsequent real returns over long horizons. Vanguard research similarly describes valuations as a gravitational force that becomes more influential as the investment period approaches a decade or longer.
This does not mean a high valuation guarantees a crash. It means investors starting from elevated prices may have a smaller margin for disappointment and should prepare for more modest long-term returns.
Think of valuation as a speedometer rather than a traffic signal. It can show that the market is traveling unusually fast, but it cannot tell you exactly where the next pothole is located.
Useful Stock Market Valuation Indicators
1. Trailing Price-to-Earnings Ratio
The trailing P/E ratio divides the current market price by earnings generated during the previous 12 months. A market trading at 20 times earnings is priced at $20 for every $1 of reported annual profit.
Trailing earnings are factual rather than forecasted, which is useful. However, they can become misleading near economic turning points. During a recession, temporarily depressed profits can make stocks look expensive even after prices have fallen sharply.
2. Forward Price-to-Earnings Ratio
The forward P/E ratio uses analysts’ expected earnings for the coming year. It may provide a better picture when profits are recovering, but forecasts can be overly optimistic. Analysts tend to revise estimates after conditions change, not before the universe sends a calendar invitation.
Forward P/E is most useful when paired with questions about profit margins, revenue growth, and the economic assumptions embedded in forecasts.
3. The CAPE Ratio
The CAPE ratio divides the market’s price by the average of ten years of inflation-adjusted earnings. By smoothing an entire business cycle, it reduces the influence of unusually strong or weak single-year profits.
CAPE is one of the best-known tools for estimating long-horizon market returns. However, accounting rules, industry composition, profit margins, interest rates, and corporate payout policies change over time. Comparing today’s CAPE mechanically with an average calculated across very different economic eras can produce false precision.
4. Earnings Yield
Earnings yield is the inverse of the P/E ratio. A market with a P/E of 20 has an earnings yield of 5%. Expressing valuation as a yield makes it easier to compare stocks with Treasury bonds, inflation-protected securities, and other investments.
The comparison is imperfect because stock earnings can grow, shrink, or disappear, while a Treasury security has contractual payments. Still, earnings yield provides a useful starting point for judging whether equity investors appear to be receiving adequate compensation for risk.
5. Equity Risk Premium
The equity risk premium represents the additional return investors expect from stocks over relatively safe government securities. It can be estimated from historical returns or inferred from current stock prices, expected cash flows, growth assumptions, and bond yields.
A wider implied equity risk premium may indicate that investors are being better compensated for accepting stock market uncertainty. A narrow premium may indicate richer prices or unusually optimistic assumptions. NYU Stern research emphasizes that implied premiums are dynamic and depend on both market prices and forward-looking cash-flow expectations.
6. Price-to-Sales and Market Capitalization-to-GDP
Price-to-sales ratios can be useful when earnings are temporarily distorted, although revenue is not the same as profit. A company can produce spectacular sales while operating a business model best described as “losing money at scale.”
Market capitalization-to-GDP compares the total value of publicly traded stocks with national economic output. It provides broad historical context, but globalization complicates the calculation because large U.S. companies generate substantial revenue outside the United States.
Recent Federal Reserve and NBER research also suggests that persistent changes in labor’s share of output, corporate investment, and profitability can keep traditional valuation measures above historical norms without guaranteeing immediate mean reversion.
Why Precise Valuation-Based Market Timing Usually Fails
Valuation Is Not a Near-Term Catalyst
A market does not decline simply because a ratio has crossed an arbitrary threshold. Prices usually need a catalyst, such as declining earnings, tighter financial conditions, excessive leverage, a recession, or a change in investor expectations.
Without a catalyst, expensive stocks can continue rising for years. An investor who sells too early may be correct about overvaluation but still suffer an expensive practical defeat.
Investors Must Make Two Correct Decisions
Successful market timing requires deciding when to sell and when to return. The second decision is frequently harder because the most attractive buying opportunities arrive when the news is still alarming.
Investors who sell after a decline often promise to reinvest when conditions become clearer. Markets, displaying their traditional lack of courtesy, frequently rebound before the economic headlines improve.
The Best and Worst Days Often Cluster Together
Strong rebound days commonly occur close to major declines. Missing only a small number of the market’s best sessions can substantially reduce long-term wealth. Fidelity and Schwab studies illustrate how quickly returns can deteriorate when investors move to cash and miss powerful recovery days.
Historical Averages Are Not Laws of Nature
Valuation ranges can change when inflation, interest rates, taxation, accounting standards, market concentration, or corporate profitability changes. A ratio above its twentieth-century average is not automatically proof that prices must immediately fall.
This is why valuation models should produce a range of possible returns rather than a single target presented with suspicious confidence and three decimal places.
Trading Creates Friction
Frequent allocation changes can generate taxes, transaction costs, bid-ask spreads, and behavioral mistakes. A market timing model may look impressive before expenses but considerably less heroic after real-world implementation.
AQR research on contrarian factor timing found that valuation-based tactical shifts were difficult to apply profitably against diversified alternatives. Research Affiliates has found more encouraging applications in selected strategies, but it also emphasizes uncertainty, implementation discipline, and the importance of relative valuation.
How to Use Valuations Without Making an All-or-Nothing Bet
Adjust Expected Returns
When broad market valuations are high, investors can lower their long-term return assumptions. This may affect retirement projections, savings targets, withdrawal rates, and the amount of risk required to reach a goal.
Lowering expectations is usually more sensible than predicting an immediate crash. An expensive market may deliver several years of modest returns, a long sideways period, a sudden decline, or surprisingly strong earnings growth that eventually justifies the price.
Rebalance Instead of Abandoning Stocks
Suppose a portfolio has a target allocation of 60% stocks and 40% bonds. After a long rally, stocks may grow to 70% of the portfolio. Rebalancing to the original target automatically sells part of an appreciated asset and adds to assets that have lagged.
This approach responds to valuation indirectly without requiring a dramatic forecast. Investor.gov notes that many professionals recommend reviewing or rebalancing portfolios periodically, commonly every six to 12 months, although the appropriate schedule depends on the investor.
Use Modest Valuation Tilts
Rather than shifting entirely to cash, an investor might make measured changes among asset classes. If U.S. large-cap growth stocks are unusually expensive relative to international, small-cap, or value stocks, new contributions can be directed toward the more reasonably priced areas.
S&P Dow Jones Indices evaluates value characteristics using metrics such as earnings-to-price, book-value-to-price, and sales-to-price. Combining several measures reduces dependence on any single accounting statistic.
Continue Dollar-Cost Averaging
Investors who contribute regularly through retirement plans already have a simple defense against bad timing. When prices decline, the same contribution buys more shares. When prices rise, existing investments participate in the gains.
Dollar-cost averaging does not guarantee profits or prevent losses, but it reduces the pressure to identify the perfect entry point. It turns market volatility into a purchasing schedule instead of a recurring emotional emergency.
Match Risk to the Time Horizon
Money needed within the next few years should not depend heavily on stock market valuations or short-term market performance. Cash reserves and high-quality fixed income can help protect near-term spending needs.
Investors with decades before retirement can usually tolerate more volatility. For them, the risk of remaining underinvested may be more serious than the risk of buying during an expensive market.
Historical Examples: Right Signal, Difficult Timing
The Late-1990s Technology Boom
Valuation measures warned that U.S. stocks, especially technology companies, had reached extreme levels during the late 1990s. Long-term caution was justified, but the market continued climbing before the bubble burst.
An investor who exited several years early could have watched prices race higher while earning modest returns in cash. The lesson was not that valuations failed. The lesson was that valuation identified long-term risk without supplying a precise expiration date for enthusiasm.
The Global Financial Crisis
During the 2008–2009 collapse, prices fell faster than normalized earnings, causing long-term valuations to improve. Yet buying felt almost irresponsible because banks were failing, unemployment was rising, and economic forecasts were grim.
Investors waiting for reassuring news often missed a substantial portion of the recovery. Attractive valuation and emotional comfort rarely arrive in the same package.
The Pandemic Shock
In 2020, trailing earnings became difficult to interpret as businesses closed and profits changed abruptly. Low interest rates, fiscal support, and the growing weight of profitable technology companies also influenced market multiples.
This period demonstrated why valuation cannot be evaluated in isolation. Investors also needed to consider interest rates, balance-sheet strength, sector composition, profit durability, and policy responses.
The 2022 Decline and 2023 Rebound
Stocks fell sharply in 2022 as inflation and interest rates rose. Although valuations declined, several broad measures remained elevated compared with long historical averages. That did not prevent a strong market rebound in 2023, illustrating once again that an expensive market can still generate excellent one-year returns.
A Practical Valuation-Based Investing Framework
Step 1: Choose a Strategic Allocation
Begin with an allocation based on financial goals, investment horizon, income stability, and ability to tolerate losses. This allocation should remain workable during both calm markets and periods when financial television begins using dramatic background music.
Step 2: Track Several Valuation Measures
Monitor CAPE, trailing and forward P/E, earnings yield, the implied equity risk premium, and relative valuations across regions and investment styles. No single ratio should control the portfolio.
Step 3: Use Valuation Zones
Classify valuations broadly as attractive, neutral, elevated, or extreme. Avoid treating one numerical cutoff as a guaranteed buy or sell signal.
Step 4: Limit Allocation Changes
Place strict limits on tactical adjustments. For example, a long-term investor might permit a stock allocation to vary only five percentage points around its strategic target. This prevents a cautious signal from turning into a permanent retreat from equities.
Step 5: Rebalance Systematically
Review the portfolio at predetermined intervals or when allocations move outside established bands. Written rules reduce the temptation to redesign the strategy in response to every headline.
Step 6: Record the Reason for Every Decision
Before making a change, write down the valuation evidence, expected benefit, major risks, and conditions that would reverse the decision. This creates accountability and exposes decisions based primarily on fear, excitement, or a suspiciously confident social media post.
Experience-Based Lessons From Valuation Decisions
The following composite experiences reflect common investor behavior rather than the personal investment history of the author.
Experience One: Selling Too Early
Consider an investor who notices that the market’s CAPE and forward P/E ratios are well above their historical averages. Convinced that a major correction is imminent, the investor sells an entire stock portfolio and moves to cash.
The market continues rising. At first, the investor remains confident because every additional gain appears to make the market even more overvalued. After another year, however, the investor begins calculating the return that was missed. Waiting becomes increasingly painful.
Eventually, the investor buys back at a higher pricenot because valuation has improved, but because watching everyone else make money has become unbearable. A correction then occurs, producing the exact loss the original sale was intended to avoid.
The problem was not the valuation analysis. The investor may have correctly identified below-average long-term return potential. The mistake was converting a long-term observation into an immediate, all-or-nothing forecast.
Experience Two: Waiting for the Perfect Bottom
Another investor keeps cash available for a downturn. When stocks decline 15%, the investor waits because a 20% drop would offer a better bargain. At 20%, the investor waits for 30%. At 30%, frightening economic news makes buying feel reckless.
After the market begins recovering, the investor assumes it is a temporary rally and continues waiting. By the time the recovery appears convincing, prices have already moved substantially higher.
A more practical approach would divide the available cash into several portions and invest according to a predetermined schedule or valuation bands. The investor would not capture the exact bottom, but exact bottoms are visible mainly in historical charts, where they perform their job with excellent hindsight.
Experience Three: Rebalancing With Modest Tilts
A third investor starts with a diversified allocation and reviews it twice a year. After a strong U.S. equity rally, stocks exceed their target weight and large growth companies appear expensive relative to other segments.
Instead of selling every U.S. stock, the investor rebalances to the strategic allocation. New contributions are directed toward bonds, international equities, and less expensive value-oriented holdings. The adjustment is meaningful but deliberately limited.
If expensive stocks continue rising, most of the portfolio still participates. If leadership changes, the cheaper assets can provide diversification and potential upside. Most importantly, the investor does not need to predict the exact date of a market reversal.
The Shared Lesson
The most successful use of valuation is usually gradual rather than theatrical. Valuation can guide expectations, savings rates, diversification, rebalancing, and small allocation changes. It becomes dangerous when it encourages investors to believe that a slow-moving measure can produce precise short-term forecasts.
A durable process accepts that no investor will consistently buy at the bottom or sell at the top. The objective is to remain invested at a risk level that can survive multiple outcomesnot to win an annual award for having the most dramatic opinion about the S&P 500.
Conclusion
Timing the stock market using valuations sounds simple: buy when stocks are cheap and sell when they are expensive. In practice, valuations do not reveal when sentiment will change, when earnings will disappoint, or how long an unusually priced market can remain unusual.
They remain extremely useful. CAPE, P/E ratios, earnings yield, equity risk premiums, and relative valuations can help investors estimate long-term returns, compare opportunities, and recognize when optimism or pessimism has reached unusual levels.
The strongest strategy is generally not to jump completely in and out of the market. It is to combine valuation awareness with diversification, periodic rebalancing, dollar-cost averaging, realistic return assumptions, and carefully limited tactical tilts.
Valuations can tell investors when the odds appear more or less favorable. They cannot tell them precisely when the next winning hand will be dealt.